Tom Hubba
As a seller in the current real estate market, it is essential to understand the correlation between various metrics to make informed decisions.
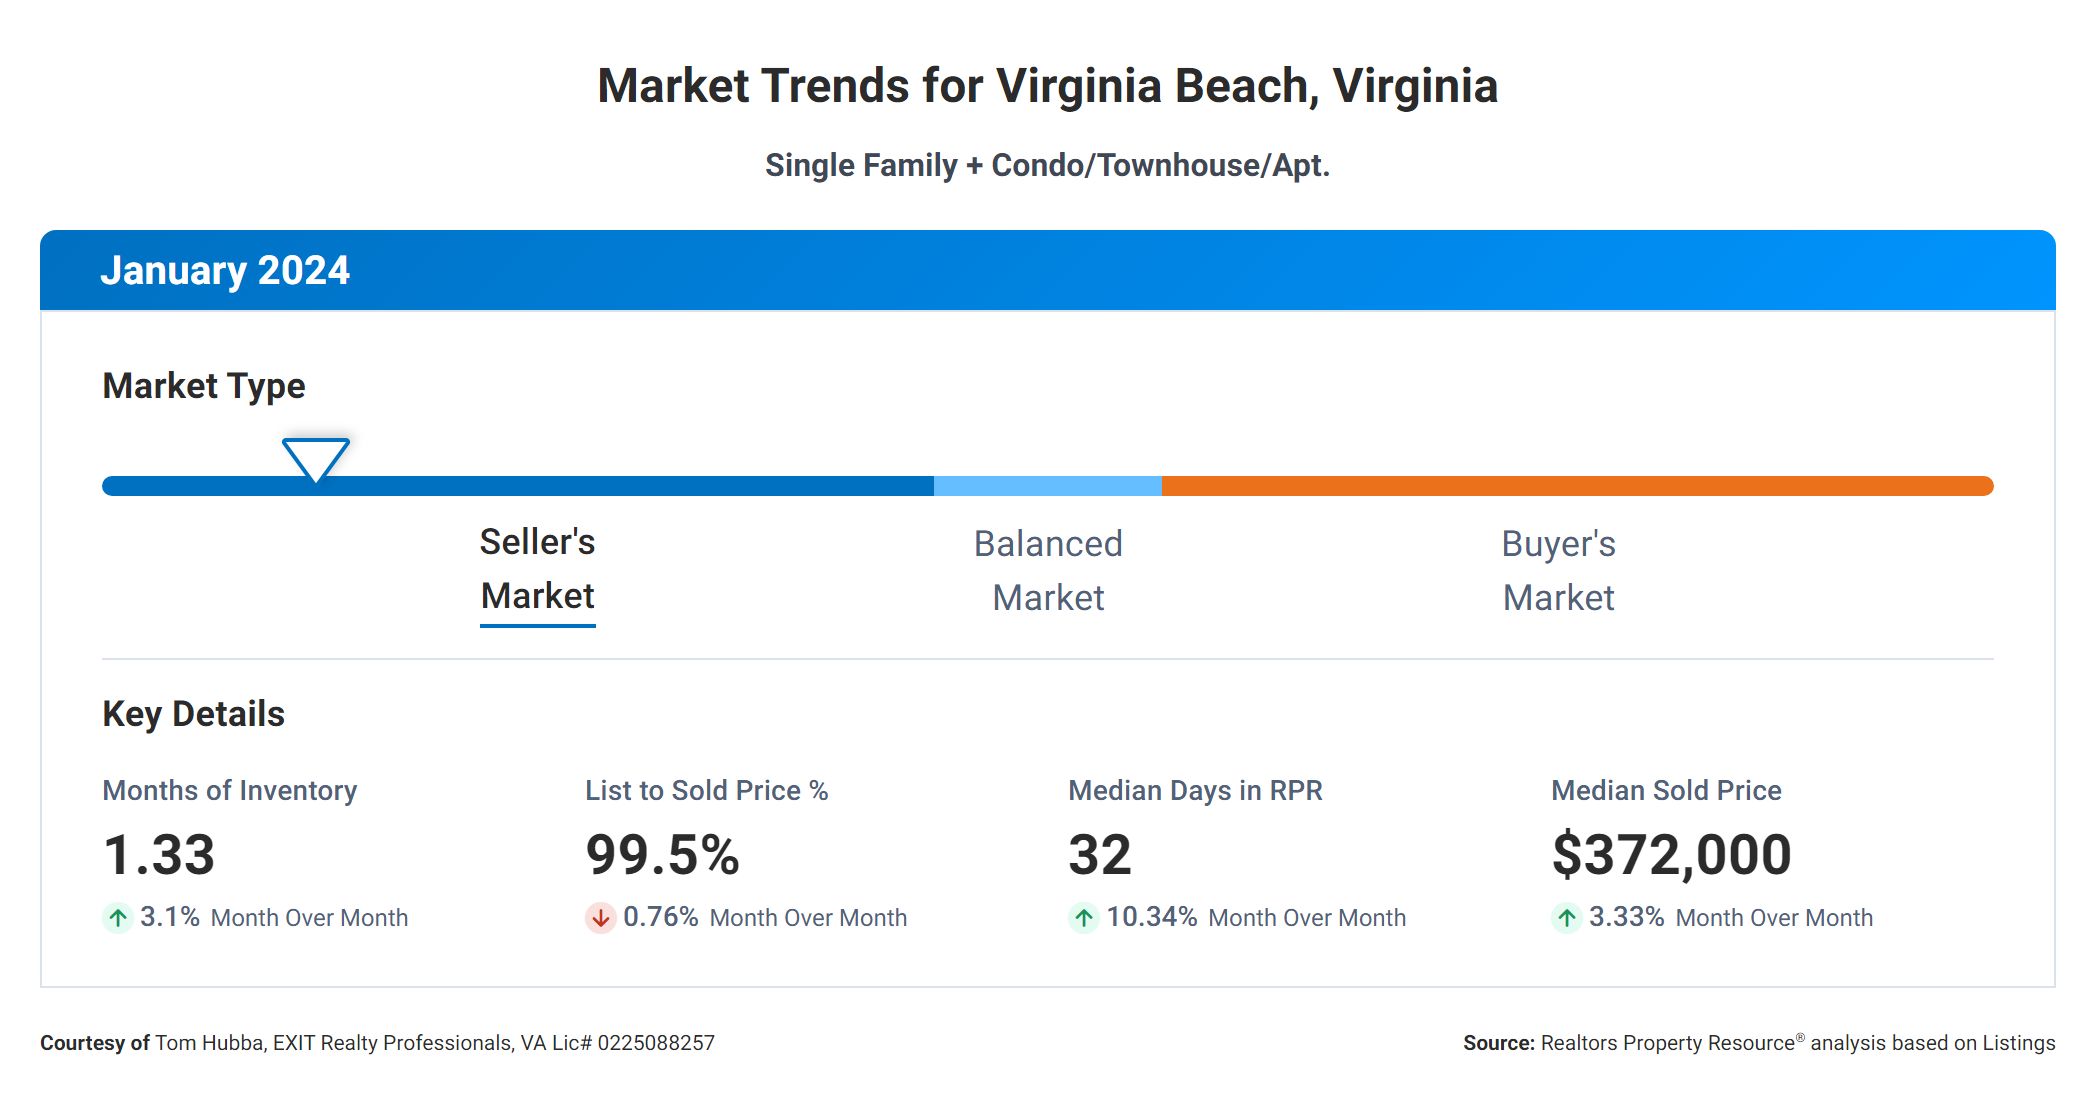
First, let's look at the Months Supply of Inventory, which is currently at 1.33. This indicates that there is a low supply of homes on the market relative to the current demand. A low supply typically leads to increased competition among buyers, potentially driving up prices.
The 12-Month Change in Months of Inventory has increased by +44.57%. This suggests that the inventory levels have been rising over the past year, indicating a potential shift towards a more balanced market. However, the supply is still relatively low, which could continue to benefit sellers.
The Median Days Homes are On the Market is 32, indicating that homes are selling relatively quickly. This could be attributed to the low inventory levels and high demand in the market. Sellers can take advantage of this by pricing their homes competitively and ensuring they are in good condition to attract buyers.
The List to Sold Price Percentage is at 99.5%, indicating that homes are typically selling very close to their listing price. This suggests that sellers are pricing their homes accurately and that buyers are willing to pay close to the asking price. This is a positive sign for sellers in terms of maximizing their sale price.
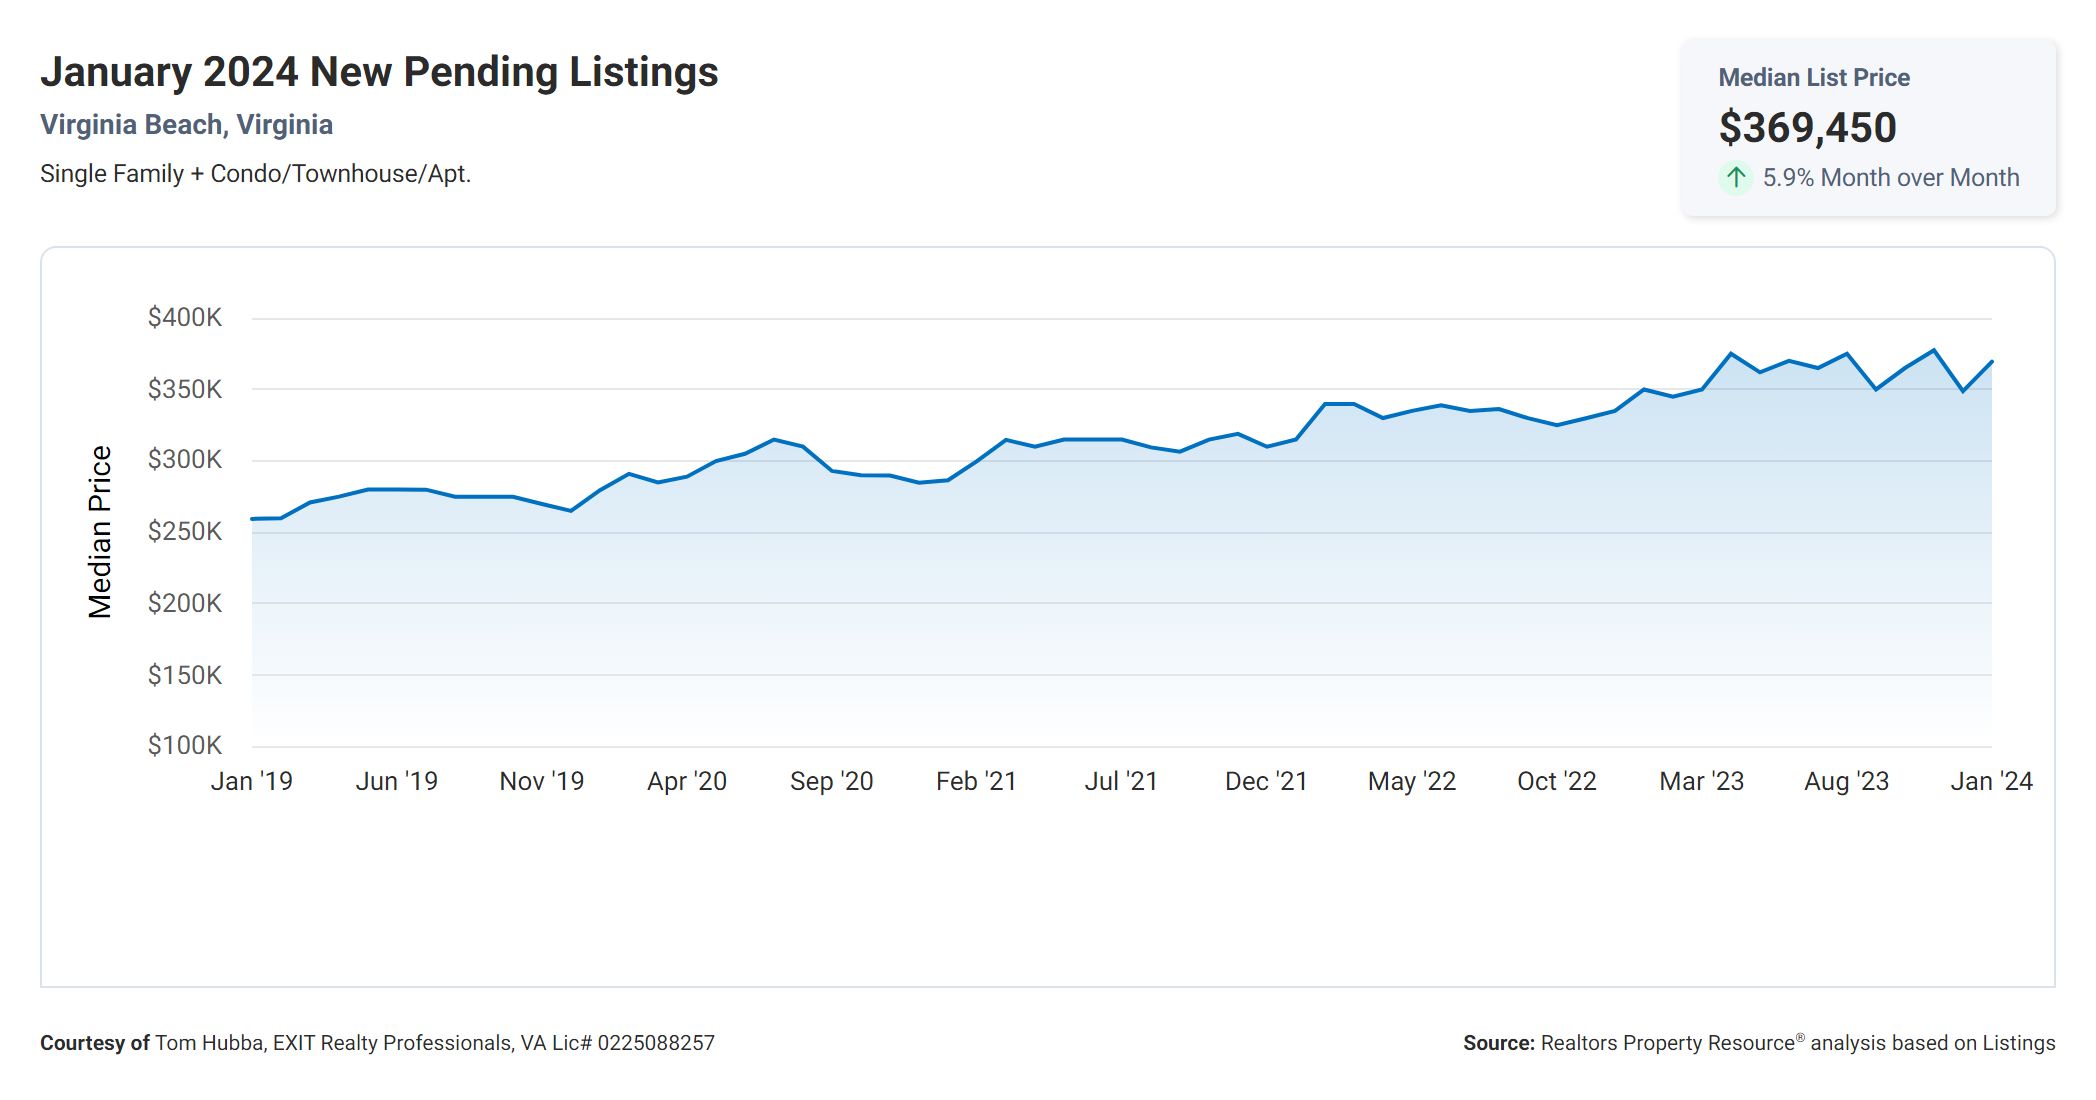
Finally, the Median Sold Price is $372,000, which provides an indication of the average price at which homes are selling in the current market. Sellers can use this information to set realistic expectations for their own property's selling price based on market trends.
In conclusion, the current real estate market is favorable for sellers, with low inventory levels, quick sales, and high list to sold price percentages. By understanding these metrics and their correlation, sellers can make informed decisions to maximize their selling potential.